May 14, 2018

May 14, 2018
Data collection and analysis is expensive and has the potential to compromise a company’s hard-won compliance position. It is therefore critical that technical leaders follow a systematic and proven approach such as the Six Sigma or DMAIIC, process improvement roadmap. This article focuses on what is sometimes referred to as “power and sample size”, one of the several critical considerations that assure effective data collection and analysis.
“Sampling” is the planned selection and testing of a portion of the population, with the intent to use the test results of the sample to draw conclusions about the population. Fortunately, since testing the entire population is likely to be prohibitively expensive, sound conclusions about the population may often be drawn from a properly defined sample.
“Power” measures the ability of a test performed on the sample to detect a difference of practical significance, if that difference truly exists. A test with low power may fail to detect a difference of practical significance, leading to the mistaken conclusion that none exists. A test with too much power could lead to the conclusion that a small, statistically-significant difference is of practical significance when in fact, it is not.
In general, sample size and power are related by the axiom, “the larger the sample, the higher the power”.
The real-world consequences of giving inadequate consideration to power when developing a sampling plan can be significant. An oversized (too much power) sample wastes data collection and analysis resources. Drawing mistaken conclusions jeopardizes budgets and timelines and when used to justify quality-risk controls, increases compliance risk.
The following (redacted) example, taken from a client’s effort to develop and qualify a leak-detection measurement system illustrates the application of “power and sample size” principles. Quite appropriately, the client’s technical leader issued a Testing Definition Document outlining the requirements. The table summarizes the sampling, testing and acceptance requirements defined for measurement system accuracy.
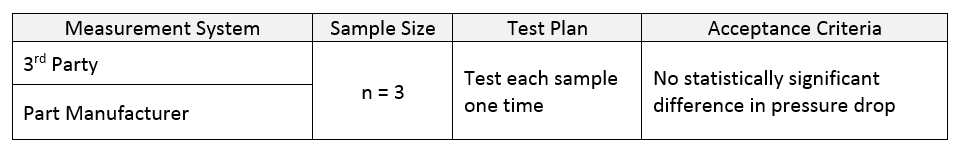
The power and sample size question is, “does a sample of n=3 provide enough power to detect an unacceptably large difference (bias) in pressure drop between the two (2) measurement systems?”.
Since this question was not addressed in either the Testing Definition Document, or any supporting document, it was premature to designate a sample size of n=3. The following power and sample size analysis illustrates why.
Since each measurement system tests each sample, the bias could best be estimated using a paired t-test. The assumed standard deviation of the bias was estimated from previous measurement system development work to be 0.014 PSI. Using this value to determine the power of the test with n=3, results in the following power analysis (from Minitab 17®):
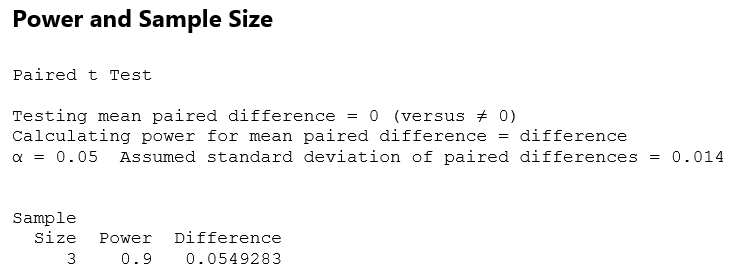
Since a leak is a critical defect, a reasonable choice for power is 0.9 or 90%. Therefore, with a sample of three (3) the test has a 90% chance of detecting a bias of 0.05 PSI. If the actual bias is greater 0.05 PSI, there is a > 90% chance of detecting it with three (3) samples. If the actual bias is less than 0.05, there is a < 90% chance of detecting it with three (3) samples; with the probability rapidly decreasing as the actual bias narrows (Figure 1).
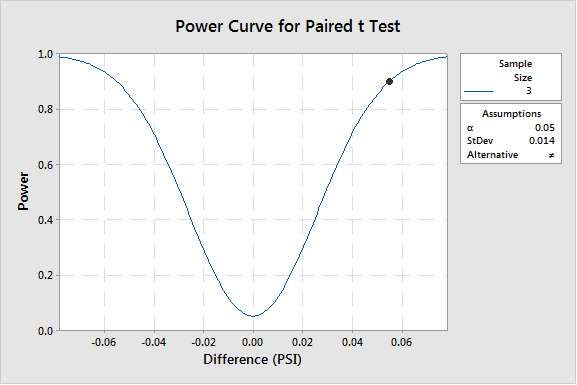 Figure 1
With the average actual pressure drop performance at 0.181 PSI and the current specification (the leak-indicating pressure drop) at 0.500 PSI, a bias of 0.05 PSI that accounts for 27% of the average and 10% of the specification, may be acceptable.
In practice, “the difference that matters” (acceptable bias, in this example) and its standard deviation are estimated by subject matter experts familiar with the performance of the actual and/or similar process(s). Even so, experience shows that it can be challenging to make accurate estimates. Consequently, the sample size estimate from power analysis should be considered the minimum and further evaluated for increase. In our example, Figure 2 illustrates the significantly smaller difference detectable at 90% power when the sample size is increased to n=6. A rule of thumb for selecting a difference of practical significance is ten times smaller than the specification range. Additionally, the impact of a low standard deviation estimate may be mitigated once sampling and testing is underway, by calculating the actual standard deviation of the sample (in this case, the standard deviation of n=3 differences) in real-time and collecting additional samples.
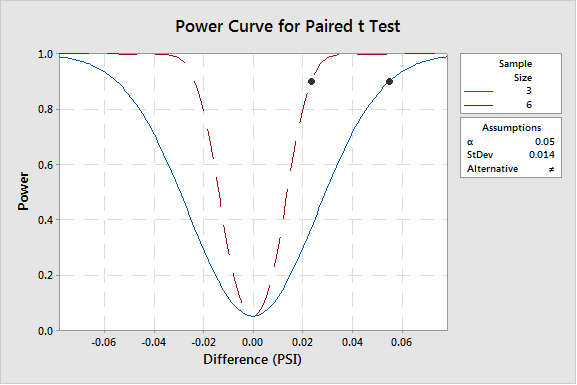 Figure 2
“Power and Sample Size” is one critical aspect of a systematic and proven approach to data collection and analysis. Using it focuses the team’s attention on evaluation of critical assumptions, cause and effect relationships and sources of variation, thereby helping to assure maximum return on data investment and solid justification for critical, quality-risk controls.
TAGS: Life Science Consulting