September 24, 2014
September 24, 2014
Many times in validation I am confronted with the problem of how to set acceptance criteria for critical process measurements. This is particularly true of in process measurements made during production that relate only indirectly to a measured characteristic of the finished product. One example comes to mind that provides an excellent illustration of the problem. This example is related to fill volume measurements performed on a liquid filling line.
Bulk product is manufactured and samples sent to the QC lab for bulk release testing. One of the tests performed is a measure of the bulk-product density. The density determined for the bulk product is used by production personnel to set up and monitor the fill volume delivered to containers by the filling equipment. Following completion of the packaging process, a number of bottles are pulled from the finished lot and the fill volume checked for compliance to specification. In this example, the specification range for container fill volume is 60.0 – 63.0 mL.
In order to keep the error associated with the gravimetric determination of fill volume relatively insignificant with respect to the fill volume specification range, limits on the maximum measurement error to be tolerated at each step in the measurement chain needed to be determined so that the total error in measurement would not exceed ten percent of the specification range for fill volume which, in this case, equates to ±0.3 mL.
Sounds simple, but no one really knew how the errors associated with the individual measurements contributed to the final measurement of fill volume. What was needed was a model to quantify the effect of errors associated with each measurement in the measurement chain. To do this, we make use of the rules for propagation of error. But, before we can begin to build the error propagation model, we first must understand a little more about the filling process.
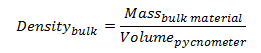
Fill volumes on the filling line are determined gravimetrically by measuring the mass of a filled container and subtracting the container empty weight. The correct weight of the filled container is determined by multiplying the container specified volume by the density of the bulk product.
| (1) |
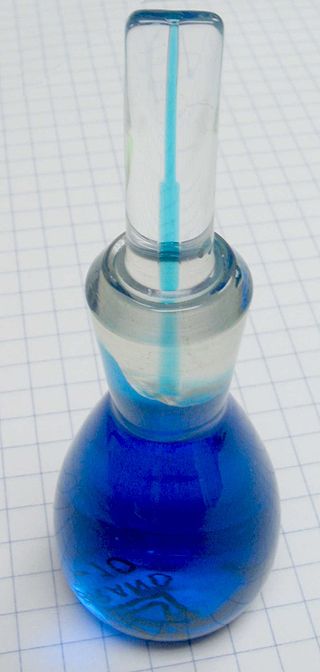 Figure 1: glass pycnometer Figure 1: glass pycnometer |
The density of bulk product is determined prior to release by the QC lab using a pycnometer calibrated against purified water. A pycnometer is a glass flask with a close-fitting ground glass stopper. The stopper has a capillary hole through it to allow air and excess fluid to escape giving a precise volume. Density is determined gravimetrically by measuring the mass of the pycnometer filled with the test-fluid.
Thus, the density of the bulk product is given by,
 |
(2) |
where the precise volume of the pycnometer is determined by measuring the mass of a suitable reference fluid such as degased purified water at a precisely known temperature.
Looking at formulae (1) and (2), three sources of potential error are apparent: mass measurement of the filled containers; mass measurement of the pycnometer; and the volume of the pycnometer. However, the density of the bulk product is also dependent on temperature, so this characteristic must also be taken into account in the model as well.
Based on this knowledge, a model for the propagation of error through the measurement chain can be constructed. We will start at the end of the chain; that is, the determination of the correct filled container weight (mass). Because fill volume is the variable of interest, equation (1) will be rearranged so that volume is a function of mass and density. Therefore,
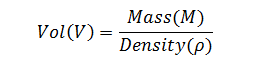 |
(3) |
Errors due to independent factors can propagate though a measurement system to cumulatively affect the response. However, because errors can be both negative and positive in magnitude, they cannot be added directly. Instead, these errors are added in quadrature. Thus, the rule of propagation of error for addition and subtraction is,
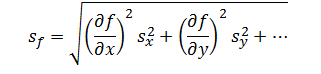 |
(4) |
Where sx and sy are the errors associated with each independent factor in the model and
The partial differential terms,  and
and  ,represent the sensitivity coefficients for each independent factor. Because the value of a sensitivity coefficient is often dependent on the value of the independent factor, sensitivity coefficients should be calculated at the factor values of interest.
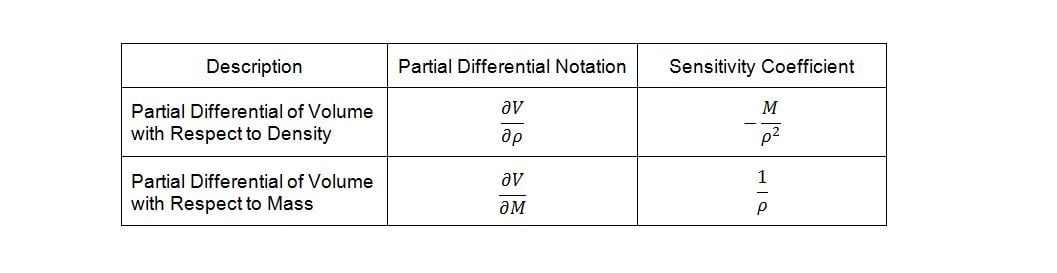
Deriving the sensitivity coefficients associated with the various factors in the model requires finding the partial derivatives of the dependent variable with respect to each of the independent variables. Given equation (4) and differentiating volume, V, with respect to density, r, and mass, M, yields the following sensitivity coefficients:
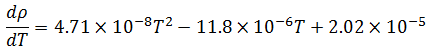
Now, temperature must also be taken into account in our model because of its effect on the density of the bulk product. The bulk product in this case is aqueous with a nominal density close to that of pure water, so we will use published density data for pure water to derive an empirical relationship. The empirical relationship in this case is a third order polynomial of the form,  . Thus, the change in density with respect to temperature is,
 |
(5) |
Differentiating the empirical formula for temperature yields the corresponding sensitivity coefficient:
 |
(6) |
For simplicity, this formula will be referred to herein as .
.
Now that the sensitivity coefficient for each of the independent variables has been determined we can begin to build the measurement error model. The error model for volume as a function of density, ?Vr, is the error associated with density, ?r,multiplied by the sensitivity coefficient for density. This yields the following expression:
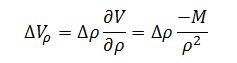 |
(7) |
Likewise the expression for volume error as a function of mass is:
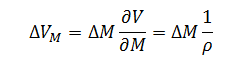 |
(8) |
Empty container mass variation also contributes to the overall fill volume measurement error; however, for the purpose of this discussion, we will assume that this variation has been accounted for in the filled-container mass measurement.
Finally, for volume error as a function of temperature, the expression is:
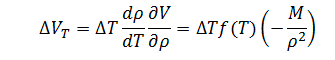 |
(9) |
Note that the sensitivity coefficient for temperature must be multiplied by the sensitivity coefficient for the change in volume with respect to density in order to achieve the proper unit conversion.
Having defined the individual expressions, they can be put together to create the complete error model for measurement of filled container volume.
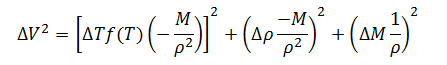 |
(10) |
We have now derived an error model for measurement of container fill volume, but we have not yet fully decomposed the measurement. The density of the bulk product is itself a dependent variable derived through measurement of the filled pycnometer volume and mass. The sensitivity coefficients in this case will be derived directly from (1).The change in density with respect to volume then is given by:
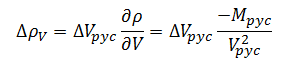 |
(11) |
The change in density with respect to mass is given by:
for base measurements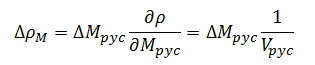 |
(12) |
Combining expressions (11) and (12) yields the combined error model for density measurement; hence:
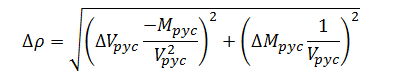 |
(13) |
Substituting expression (13) for ?rin (10) gives the final model for gravimetric fill-volume measurement error; thus,
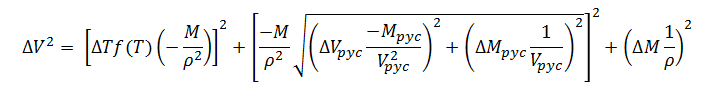 |
(14) |
With the full model in hand, we can use (14) to determine the maximum error that can be tolerated for each base measurement in the measurement chain. This is best accomplished by performing calculations using different values of ?T, ?Vpyc, ?Mpyc, and ?Mcontainer.
Prior to performing the calculation, the variability associated with each of the base measurements should be determined. The variability (standard deviations) associated with each base measurement in this example are listed in Table 1.
Table 1: Standard uncertainties
To perform the calculation, a range of values around the known variability associated with each measurement are selected and a dataset prepared for analysis.
The analysis consists of an analysis of variance (ANOVA) and individual value plots of the container fill volume error versus the range of error values chosen for each base measurement. ANOVA outputs for each base measurement are summarized in Table 2. Individual value plots for each measurement are shown in Figure 2.
Table 2: ANOVA outputs for the base measurement propagation of error data. The Estimated coefficient column lists coefficients corresponding to the best-fit line for each term. P values indicate the level of significance of each term.
Looking at the ANOVA output for each of the base measurements, the filled container mass measurement yields the lowest P values for the linear and quadratic terms indicating that this measurement has most significant effect on the overall variation of gravimetric fill volume measurements.
This conclusion can be visually confirmed looking at the individual plots in Figure 2. Of the four plots shown, the plot for container fill volume error versus container filled mass error has the largest slope and tightest clustering of individual values about the fitted line. The large slope and tight clustering further confirm that this measurement is the largest source of variation in the measurement of fill volume. The pycnometer mass and volume measurements also contribute variation, but to a lesser degree than the container mass measurement. The plot of container fill volume error versus temperature error has an almost nonexistent slope and wide distribution of individual values, indicating that the error associated with temperature measurement has virtually no effect on the variation of fill volume measurements over the range of temperature error values examined.
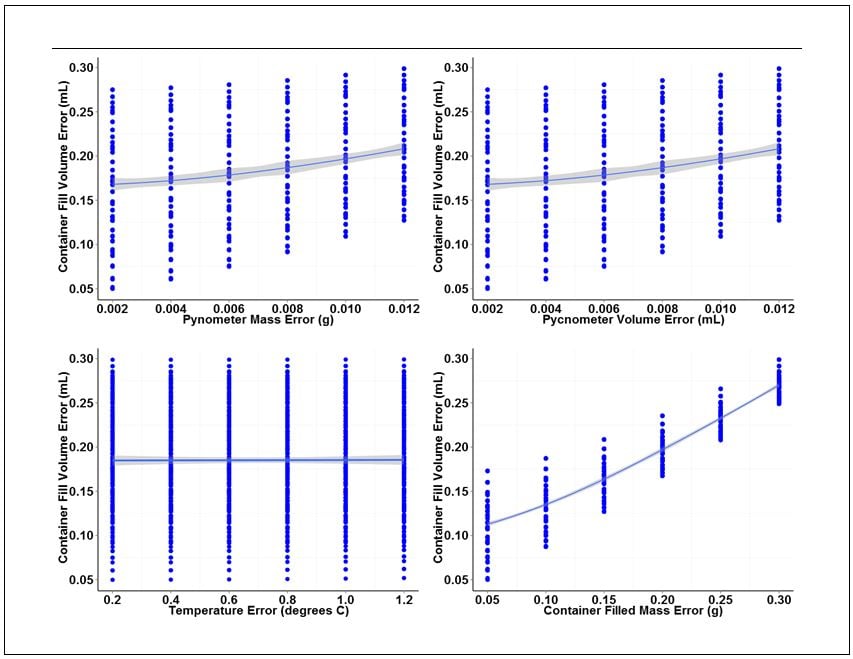
Figure 2. Individual value plots for each of the four base measurements associated with gravimetric determination of container fill volume.
The individual value plots also show that a 0.012 g mass error and a 0.012 mL volume error can be tolerated for the pycnometer density measurement without exceeding our error budget for container fill volume. A filled-container mass error of 0.30 g can also be tolerated. Temperature error, on the other hand, has virtually no effect on fill volume variation. However, because we did not include data for temperature variation greater than 1.0 degree C, we will set the upper error limit for temperature to this value.
Now, there is the possibility that the temperature at which the density of the bulk material was determined can differ significantly from the bulk product temperature measured during the filling process. Depending on the thermal expansion coefficient of the material being filled, a temperature change of 10 degrees C or more could significantly alter the density of the bulk material. In this case, the thermal expansion coefficient should be known beforehand and the appropriate correction factor applied to correct to the reported density to the measured temperature.
Applying the rules of error propagation to critical in-process measurements provide an excellent method for quantifying the effect of errors inherent in base measurements in a measurement chain. By developing a complete error propagation model, the significance of the effect of each base measurement on a final product measurement can be determined. Furthermore, developing a complete error propagation model allows numerical computation of limits of tolerable error for each base measurement which can serve as the basis for setting validation acceptance criteria.
1Empirically derived formula. Data source:Handbook of Chemistry and Physics.71st Edition, pp. 6-8
TAGS: Analytical Instrument Qualification Life Science Consulting