Many active ingredient assay failures can be attributed to weighing and charging errors incurred during the compounding process. Even when the active ingredient is weighed and charged correctly, there can still be errors due to inaccuracies associated with the balances and scales used. But just how inaccurate can a balance or scale be before there is a significant impact to the quality of a drug product?
A worst-case situation would be that of a process just barely capable of producing assay results within the stated specification limits for the product. Suppose a balance purported to be accurate to +- 0.01% of reading is found to be reading 0.5% high after being used to weigh an active ingredient. The active ingredient specification range for the product is 90 to 110% of the target assay or, equivalently +- 10%.
At first glance, it would seem that an accuracy shift as drastic as 0.5% for an instrument held to an accuracy of +-0.01% of reading would be a major cause for alarm. However, a little analysis using probability distributions shows that the true impact to the product may not be as serious as initially thought.
The probability of a +- 0.5% weighing error causing a greater number of non-conforming active ingredient assay results can be calculated using the cumulative standard normal distribution. Consider the case in which a centered process yields a capability index (CPK) for active-ingredient assay measurements equal to 1. A CPK of 1 means that the distribution of assay measurements, m +- 3s, is just able to fit within the upper and lower assay specification limits. For normally distributed data, the interval corresponding to +- 3s is given by:
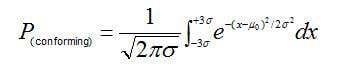
wherem0 is the target mean and P(conforming) is the proportion of assay measurements falling within the capability bounds.
For a process CPK of 1, this proportion equates to 99.73% of the data distribution; thus if the process is perfectly centered on the target assay, only 0.27% of the measurement population would be expected to exceed the upper and lower capability bounds.
If there is a 0.5% shift in the amount of active material in the product due to a weighing error, we can determine mathematically the increased probability of observing an out-of- specification active ingredient assay.
For a specification range of 90 - 110% of target assay, let's again assume a CPK=1. Then let m0 = target active ingredient content (100% of label claim); and m1 = m0 + 0.5% mean shift (100% + 0.5%) = 100.5%). Sigma in this case can be estimated as one half of one-third of the specification range: s = (110% - 90%)/(2*3) = 0.33%.
The change in the probability (Δ)P) of having a non-conforming measurement due to the weighing error is then obtained by taking the difference of two integrals; one calculated using m0, the other using m1:
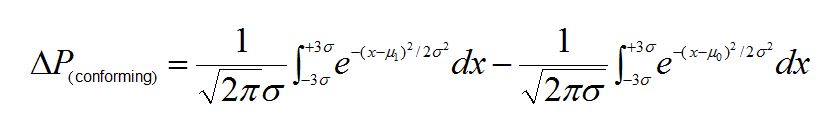

For a process CPK = 1, a 0.5% mean shift yields a P(conforming) of 0.0003 representing a 0.03% increase in the number of non-conforming measurements.
The 0.03% increase in the number of non-conforming units is equivalent to saying that for a minimally-capable process; i.e., a process yielding a Cpk = 1, we are only likely to see three additional non-conforming units in a batch of 10000.
In this example, even assuming a worst-case process capability, the impact to the active-ingredient assay is negligible. By accepting a CPK of 1 we are already allowing 0.27% or 27 units out of 10000 to potentially fall outside of the assay specification. The additional three potential non-conforming units due to the measurement bias of the balance represent only a 10% increase over what is already being tolerated. For a much more capable process; i.e., a CPK much greater than 1, the increase in potential non-conforming units would be reduced to near zero.
This is why many calibration program SOPs require the ratio between process specifications and measurement tolerances to be greater than one-to-one and preferably greater than four-to-one. Higher accuracy ratios minimize the impact of measurement inaccuracies - even those outside of the instrument's stated tolerance range.
So even though you may have an out of tolerance condition, do the math, the impact to the process may not be as severe as appears at first glance. Crunching through the numbers can go a long way in defending product quality even when critical measurements are seemingly in question.
Learn more about ProPharma's Method Qualification services.
Contact us to get in touch with our subject matter experts for a customized presentation.
TAGS: Analytical Instrument Qualification Life Science Consulting