February 18, 2014

February 18, 2014
 Impact of Wavelength Accuracy and Precision on Spectrophotometric Measurements: A while back I was involved in a Quality Assurance project reviewing calibration specifications for analytical instrumentation. The client had implemented a new requirement that all calibrated instruments have a documented calibration master record including, among other things, the relationship between the calibration specifications and the method requirements. In order for the calibration to be valid, the instrument tolerance for each calibrated parameter had to be at least as stringent as the method tolerance for the same parameter.
One of the instruments I reviewed was a UV/VIS spectrophotometer. Spectrophotometers are light sensing instruments that utilize a light-dispersion device called a monochromator to produce a narrow bandwidth of monochromatic light. The monochromatic light is passed through a sample where it is absorbed or transmitted depending on the wavelength of the incident light. The amount of monochromatic light transmitted through the sample is registered by a detector and converted to an electrical signal that is displayed on a readout device. Most spectrophotometers have adjustable monochromators allowing a sample to be scanned across a wide range of spectral wavelengths. Sophisticated spectrophotometers are capable of double-beam scans where both a sample material and a reference material are subject to the same incident light simultaneously during a scan.
During the review of the spectrophotometer calibration requirements I noticed that there was a calibration specification for the photometric (absorbance) scale; but no specification for the wavelength scale was provided. I contacted the client to see if this was an oversight or if there was a legitimate reason for omitting a wavelength scale specification. During the discussion, the client quite confidently stated that there was no need for a wavelength scale specification. The client justified this assertion by saying that, “the spectrophotometer is used to perform USP identification and assay tests for Niacin. The USP monograph does not specify ranges around the target wavelengths and the measurements are made relative to a reference standard; therefore, any inaccuracy in wavelength would affect both standard and sample measurements equally and thus cancel out.” That sounded reasonable provided the method only required measuring the difference in absorbance between the sample and reference materials and the scans were performed simultaneously using a double-beam capable spectrophotometer. However, on further inquiry, the client admitted that they were performing the measurement using a single-beam spectrophotometer and that the sample and reference standard were being scanned separately. To further complicate the issue, the identification test for Niacin described in the USP monograph is a relative absorbance method where the ratio of the sample absorbance minimum at 237 nm and the sample absorbance maximum at 262 nm must be within the acceptance range of 0.46 – 0.50. In this situation the impact of a wavelength scale error is not as clear.
Spectrophotometric measurements are composite measurements; that is, the instrument response is dependent on multiple input variables. The most significant variables in this case, are the wavelength of the incident light and the absorbance exhibited by the sample at the incident wavelength. Most materials in solution will absorb incident light at a rate that varies with wavelength. Plotting the absorbance of the material against wavelength yields a graph called a spectrum. A spectrum for Niacin in the ultra-violet wavelength region is provided in Figure 1.
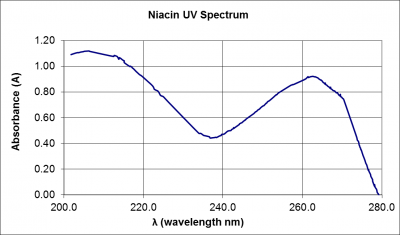
Figure 1: Spectrum of a 1.95 x 10⁻⁴ mol/L niacin solution in the ultra-violet wavelength region
Now, if scans are being performed on the sample and reference materials separately, what we must be most concerned with is the repeatability (precision) of instrument wavelength scale. The degree to which a change in wavelength will impact a photometric scan is dependent on the width of the individual spectrum maxima (peaks) and minima (troughs) being scanned. Figure 2 shows photometric scans of an idealized broad absorbance peak. The first scan (blue scan) has an absorbance peak at  =240 nm (blue scan). The second scan (red) is the same peak wavelength shifted to the right 5.0 nm (Peak=245 nm).
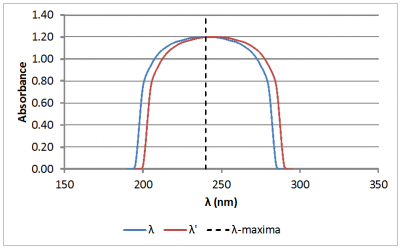
Figure 2: Spectral scan of an idealized broad absorbance peak. The blue line is the original scan. The red line is the same scan, but wavelength () shifted to the right 5.0 nm. The wavelength of the absorbance peak for the original scan is represented by the vertical dashed line.
Impact of Wavelength Accuracy and Precision on Spectrophotometric Measurements (con't): As can be seen in Figure 2, the 5.0 nm shift in wavelength does not yield a significant change in absorbance. This is because the slope of the absorbance curve near the absorbance peak is nearly flat. In contrast, look at Figure 3. Figure 3 shows scans of an idealized sharp absorbance peak. Again the second scan (red) represents the same peak wavelength shifted 5.0 nm. Notice that the difference in absorbance readings at 240 nm between the original scan and the wavelength-shifted scan is quite significant in this case. The absorbance reading for the wavelength-shifted scan is only 40% that of the original scan!
Figure 3: Plot of idealized sharp absorbance peaks. The difference in absorbance between the original scan (blue) and the wavelength shifted scan (red) at the original wavelength is indicated to the left of the scans.
For sharp absorbance peaks or troughs where absolute absorbance or transmittance is being measured, it is obvious that wavelength repeatability is very critical to making accurate photometric comparisons. But is wavelength also critical when making relative measurements?
Take for example the USP Identification Test for Niacin. This test involves scanning a 0.02 mg/mL concentration of Niacin in a prepared buffer solution. The sample solution is scanned from 200 to 300 nm. Remember that the acceptance criterion for this test is that the ratio of the absorbance measured at 237 nm to the absorbance measured at 262 nm is within the range of 0.46-0.50. Taking the Niacin spectrum from Figure 1 and adding an identical scan that is wavelength shifted by 1.0 nm yields Figure 4:
Figure 4: Plot of Niacin in the ultra-violet wavelength region. The green line is the original scan. The blue line is the same scan, but wavelength () shifted to the right 1.0 nm. The target wavelengths of 237 nm and 262 nm indicated in the USP monograph for Niacin are represented by the vertical red lines.
Impact of Wavelength Accuracy and Precision on Spectrophotometric Measurements (con't): At first glance, the 1.0 nm shift does not seem like it would have that much of an impact on the result. However, a closer inspection of the scans at 237 nm (Figure 5A) and at 262 nm (Figure 5B) tells a different story. The absorbance value of the original scan (green scan) is 0.4412 at 237 nm and 0.9182 at 262 nm. Dividing 0.4415 by 0.9182 yields 0.4808 which is nearly the center of the acceptance range of 0.46 – 0.50. The absorbance value of the second scan (blue scan) is 0.4560 at 237 nm and 0.9067 at 262 nm. Dividing 0.4560 by 0.9067 yields 0.5029 which exceeds the upper limit of the acceptance range. So, for this example, we can see that a wavelength error as little as 1.0 nm could potentially lead to a failing result.
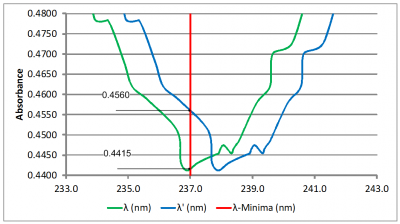
Figure 5A
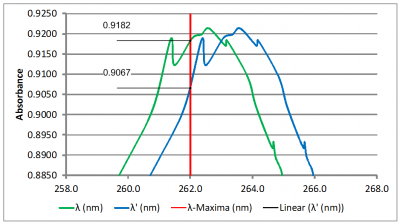
Figure 5B
Figures 5A and 5B: Close-up views of the Niacin absorbance minimum and maximum. The red vertical lines indicate the reference wavelengths of 237 nm and 262 nm, respectively. The absorbance values at the reference wavelength are shown to the left of each scan.
What we can see from the discussion above is that errors in the wavelength scale of a spectrophotometer can indeed have a significant impact on photometric measurements even when wavelength is not called out specifically as an acceptance criterion for the analytical result. In fact, this conclusion, in a general sense, can be extended to all analytical methods involving composite measurements. In essence this means that each variable in a composite measurement must be assessed for the individual contribution to the total measurement error regardless of the variable’s status as an acceptance criterion for the result.
So, even though the USP monograph for Niacin did not include acceptance ranges for the target wavelengths, there is still a limit of wavelength error that can be tolerated by the method. Ideally, the maximum wavelength error propagated through to a photometric result should result in a photometric error no greater than one-tenth of the acceptance range. Thus, in the USP identification test discussed earlier, we saw that a 1.0 nm error in the wavelength scale of the instrument can propagate to the absorbance results yielding a 0.02 change in the calculated absorbance ratio. Therefore, to keep the error contributed by the wavelength scale relatively insignificant with respect to the photometric measurement, we would want to maintain the wavelength error no greater than 0.1 nm.
After presenting these arguments to the instrument client, the client agreed that a wavelength scale specification should indeed be included in the calibration master record for the instrument.
Learn more about ProPharma Group's Technical Solutions services.
Contact us to get in touch with our subject matter experts for a customized presentation.
TAGS: Analytical Instrument Qualification Life Science Consulting
October 5, 2021
Although not required, a Pre-IND Meeting is a critical milestone, one that is highly recommended by the FDA. The goal of the meeting is to receive general agreement from FDA that your drug...

May 7, 2014
As the pharmaceutical supply chain evolves, at some point product/technology transfers will become part of the improvement process. When transferring production from site to site, an array of complex...

December 31, 2015
Introduction A key prerequisite activity for any successful process validation is process characterization. Process characterization involves varying process inputs such as raw material properties,...