December 31, 2015

December 31, 2015

A key prerequisite activity for any successful process validation is process characterization. Process characterization involves varying process inputs such as raw material properties, machine settings and environmental conditions to determine the effect on a process output. The impact of an effect is then determined by measuring a specific characteristic representative of the process output. The characteristic measured could be, for example, the length of a manufactured part, the weight of a container, or the pH of a solution. In these examples, the measurements yield values or numbers that can be plotted on a continuous numerical scale. Measurements yielding numerical data are said to be quantitative measurements.
But not all measurements yield numerical data. Some measurements yield results based on a specific property or attribute of an object determined organoleptically using one of the five senses such as color or taste. Measurements based on an organoleptic property of an object are said to be qualitative measurements. Due to expediency, a lack in confidence in the objectivity of the measurement, or both, qualitative data are often reported as pass/fail or go/no-go. But characterizing a process using a binary measurement such as pass/fail or go/no-go can be exceedingly difficult due to the shear lack of information that attribute data provide about the true state of a process. This deficiency can be easily overcome, however, by applying a little creativity in the reporting of the results.
An excellent example of this problem is a heat seal process for plastic containers. Heat seals are multi-layered sandwiches of cardboard, wax, foil, and glue placed inside the container cap. When the capped container is passed under an inductive heat sealing device, the wax layer melts heating the foil and glue causing the foil to adhere securely to the mouth of the container.
Sealing processes on a packaging line are usually assessed by simply verifying that an adequate seal is achieved and the results reported as either pass or fail. However, there are many factors that can influence the integrity of the achieved seal. These factors include seal and container materials, line speed, heat seal device power, distance of the seal from the heat seal device heating head (seal head gap) and initial cap application torque. Adequately characterizing a process with this many factors is nearly impossible using pass/fail data alone. Pass/fail data only allow a very rudimentary analysis to be performed and a large number of trials are needed to have any statistical confidence in the results. What is needed is a method of reporting seal quality that enables a quantitative assessment of the seal quality results.
Rather than express heat seal results simply as pass or fail, seal quality can be expressed numerically by assigning values to the levels of seal quality achieved. For example, the values -2, -1, 0, +1 and +2 can be assigned to no seal, partial seal, perfect seal, overheated seal, and burnt seal, respectively. Such a scale allows qualitative data to be converted directly to numerical data which then can then be analyzed using conventional numerical methods such as ANOVA or regression.
To illustrate the concept, consider an experiment conducted to examine the effect of line speed, heat sealer output power and seal head gap. The experiment is a randomized full-factorial design with one center point and two replicates. For this experiment, screw cap application torque is assumed to be constant and therefore not included as a factor.
Ten containers with heat seals and applied screw caps are passed through the heat sealer for each run. A total of seventeen runs are needed, two for each combination of high and low settings of the heat seal factors, and one run at the middle setting of each factor. The seal quality data for each run are presented in Table 1.
|
Run No. |
Line Speed |
Output Power (%) |
Seal Head Gap |
Container # (Coded Seal Quality Results) |
|||||||||
|
1 |
2 |
3 |
4 |
5 |
6 |
7 |
8 |
9 |
10 |
||||
|
1 |
9 |
80 |
0.375 |
-1 |
0 |
-1 |
-2 |
-1 |
0 |
-1 |
-2 |
-2 |
-2 |
|
2 |
2 |
80 |
0.125 |
0 |
0 |
0 |
0 |
0 |
0 |
0 |
0 |
0 |
0 |
|
3 |
2 |
80 |
0.375 |
0 |
0 |
-1 |
0 |
0 |
0 |
0 |
0 |
0 |
0 |
|
4 |
9 |
80 |
0.125 |
0 |
0 |
0 |
0 |
0 |
0 |
0 |
0 |
0 |
0 |
|
5 |
9 |
80 |
0.375 |
0 |
-1 |
0 |
-2 |
0 |
-2 |
-1 |
0 |
-1 |
0 |
|
6 |
2 |
80 |
0.375 |
-1 |
0 |
0 |
0 |
0 |
0 |
0 |
0 |
0 |
-1 |
|
7 |
9 |
100 |
0.125 |
0 |
0 |
0 |
0 |
0 |
0 |
0 |
0 |
0 |
0 |
|
8 |
2 |
80 |
0.125 |
0 |
0 |
0 |
0 |
0 |
0 |
0 |
0 |
0 |
0 |
|
9 |
2 |
100 |
0.375 |
0 |
0 |
0 |
0 |
0 |
0 |
0 |
0 |
0 |
0 |
|
10 |
9 |
100 |
0.375 |
-2 |
-1 |
-1 |
-1 |
0 |
-1 |
-1 |
-2 |
-2 |
-2 |
|
11 |
9 |
100 |
0.125 |
0 |
0 |
0 |
0 |
0 |
0 |
0 |
0 |
0 |
0 |
|
12 |
2 |
100 |
0.125 |
1 |
1 |
1 |
1 |
1 |
1 |
1 |
1 |
1 |
1 |
|
13 |
5.5 |
90 |
0.250 |
0 |
0 |
0 |
-1 |
0 |
0 |
0 |
0 |
0 |
-1 |
|
14 |
9 |
100 |
0.375 |
0 |
-1 |
-1 |
-1 |
-1 |
0 |
-1 |
-1 |
-2 |
-2 |
|
15 |
2 |
100 |
0.375 |
0 |
0 |
0 |
0 |
0 |
0 |
0 |
0 |
0 |
0 |
|
16 |
9 |
80 |
0.125 |
0 |
0 |
0 |
-1 |
0 |
-1 |
-1 |
0 |
0 |
0 |
|
17 |
2 |
100 |
0.125 |
1 |
1 |
1 |
1 |
1 |
1 |
1 |
1 |
1 |
1 |
|
Seal Quality Code Legend |
-2 = No Seal, -1 = Partial Seal, 0 = Perfect Seal, 1 = Overheated Seal, 2 = Burnt Seal |
||||||||||||
The seal quality data presented in Table 1 are fitted to a General Linear Model (GLM). The GLM output is summarized in Table 2.
|
Estimated Coefficients |
Standard Error |
t value |
P value |
|
|
(Intercept) |
-0.03004 |
0.353924 |
-0.085 |
0.932457 |
|
Line Speed (m/min) |
-0.11071 |
0.010754 |
-10.295 |
< 2e-16 |
|
Output Power (%) |
0.01375 |
0.003764 |
3.653 |
0.000347 |
|
Seal Head Gap (inch) |
-3.10000 |
0.301126 |
-10.295 |
< 2e-16 |
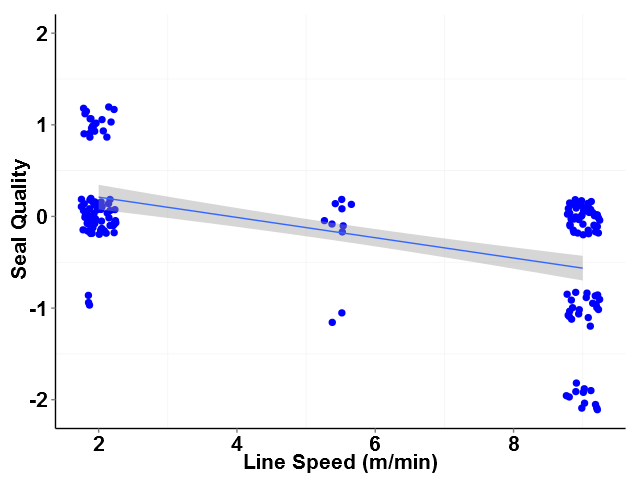
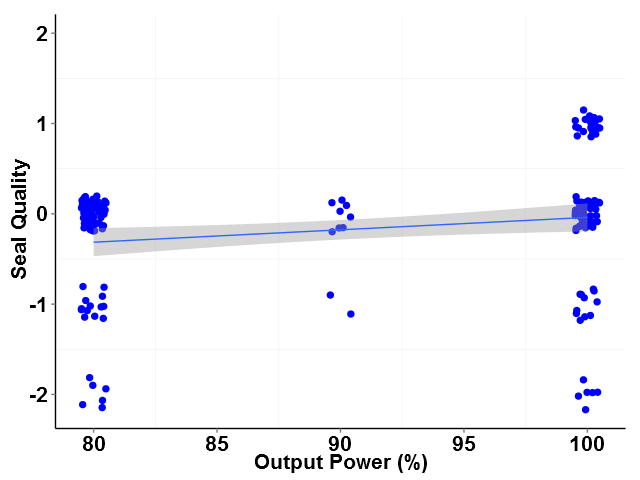
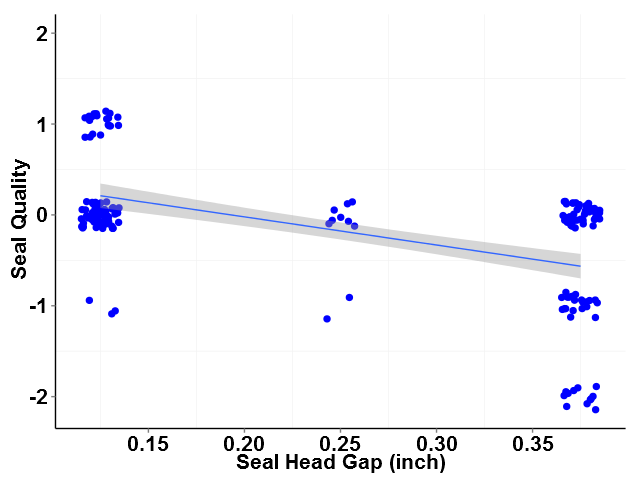
As can be seen in Table 2, all three factors are statistically significant as evidenced by P-values much less than 0.05. However, looking at the individual value plots for seal quality versus factor (see figures 1, 2 and 3), the slope of the best fit line for output power can be seen to have a much smaller slope compared to lines plotted for the other factors. This suggests that output power has much less influence over seal quality than do line speed and seal-head gap over the range of output power studied.
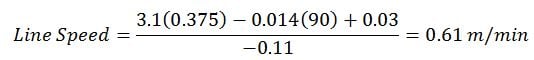
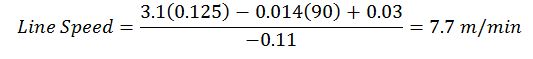
In addition to estimating the significance of each factor, the Estimated Coefficients from Table 2 can also be used in a linear equation to predict Seal Quality given specific values for the three factors included in the experiment. For this example, the relationship is:
![]()
Entering values for any two factors in the formula above, the optimum setting of the third factor can be determined numerically. For example, suppose an Output Power of 90% and a Heat Seal Gap of 0.375 inch are selected. The optimum seal quality is “0”; therefore, plugging these values into the heat seal equation and solving for line speed yields,
Likewise, if a higher line speed is needed, the seal head gap could be decreased to 0.125 inch and the heat seal equation solved as before:
Qualitative data present a special problem for experimenters attempting to optimize a multi-factor process. Qualitative data are usually reported as attribute pass/fail data. But attribute data do not provide sufficient information to adequately characterize and optimize a process. This inadequacy can be overcome by categorizing (coding) qualitative results according to a predefined numerical scale. Coding qualitative data enables the use of numerical analysis techniques to achieve more precise characterization of the process under study. Furthermore, coding of qualitative data allows the development of mathematical models that can be used to predict optimum settings for individual process parameters ultimately leading to greater process performance.

January 2, 2014
If you have been following along, you now know that I have reviewed the first three gates to the Nine Gate Transfer Process for moving production from site to site. I have covered: Gate 1: Assessment...
December 5, 2013
Today I would like to present the third entry in the series discussing the Nine Gate Transfer Process for moving production from site to site: the Gate 3 Transfer Plan. In case you missed them, you...

November 26, 2013
A wise man recently told me that “honor and respect should be given freely, but trust is earned”. Whether it’s in politics, friendships, church, marriages, parenting or even the business world,...