September 16, 2015
September 16, 2015
Generating process data is expensive: Costs include materials, process time and the focus of highly-compensated subject matter experts. Unfortunately, many organizations don’t get their money’s worth because too little attention is paid to data collection planning and subsequent data analysis. While such shortcomings result in significant amounts of wasted effort, the good news is that there are tried and true techniques available to maximize the return on data investment.
Effective data analysis depends on clear articulation of the question(s) you want to answer (hopefully, why you collected the data in the first place) to create value, e.g., restore a process, decrease cycle time, or reduce variation; an appreciation and deployment of basic statistical thinking; and a team approach that recognizes that product and process SME’s are often not (nor should they be expected to be) Data Analysis SME’s (DASME’s).
That’s not to say that data analysis must be complex and accessible only to the DASME. To the contrary, the DASME is responsible to perform analysis and transfer understanding in a way that allows the team to see more clearly and arrive more quickly to those “a-ha” moments. The DASME should create awareness and attention to basic statistical principles such as replication, confidence intervals, common cause vs special cause variation, all of which provide context for the analysis, allow the process to speak (are you listening?) and put a check on our tendency to cause-jump.
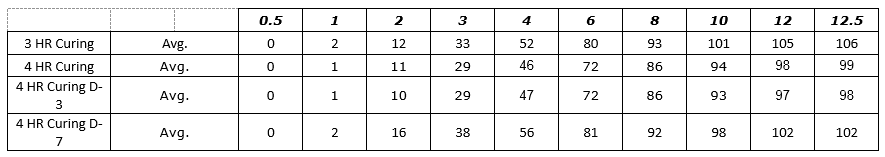
In the following (redacted) example, the process SME’s designed and executed a study to understand the impact of “cure duration” and “hold time” on cumulative release in each interval. The process SME’s released the study results and analysis to the broader team in a spreadsheet of four (4) worksheets shown in Figure 1 – Figure 4. While all the information is present, this analysis technique makes it difficult to understand the effect/significance of each variable (flipping back and forth between worksheets) and nearly impossible to understand their interactions. Consequently, the process SME’s spent far too much time reaching even cursory conclusions and they completely missed some greater insights lurking in the data. A subsequent analysis by the DASME told the story in one graph, shown in Figure 5. The effect/significance of cure and hold times are readily apparent, as are their interactions and their change by interval, which provide the process SME with a basis for hypothesizing and ranking likely causes.
Gary Hyde is a Principle Consultant of Program Management with ProPharma Group and a Johnson & Johnson Certified Six Sigma/Lean Master Black Belt.

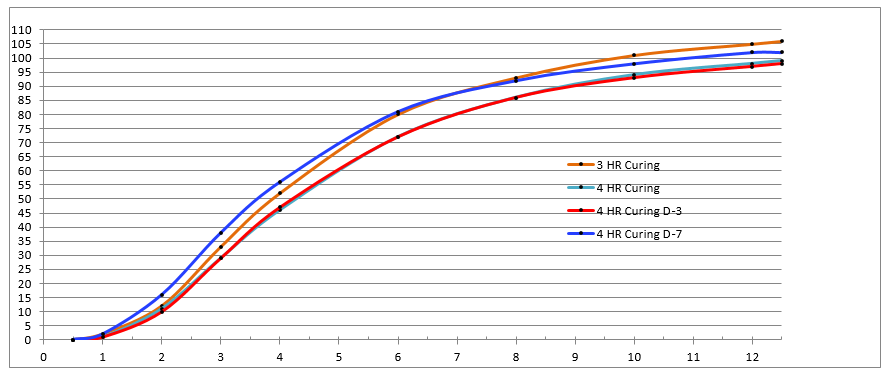 Figure 1: Process SME’s Data Analysis – Excel Worksheet 3-4 HR
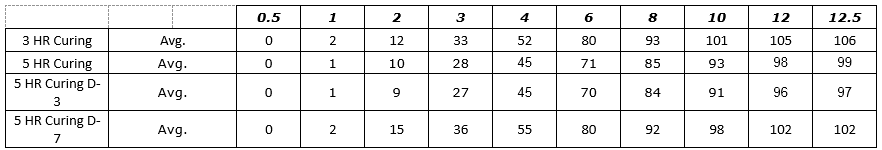
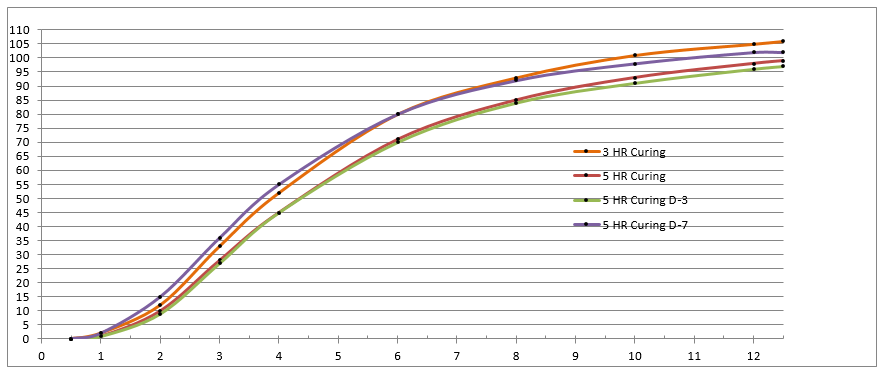 Figure 1: Process SME’s Data Analysis – Excel Worksheet 3-5 HR
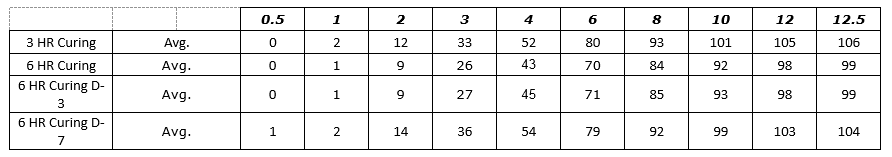
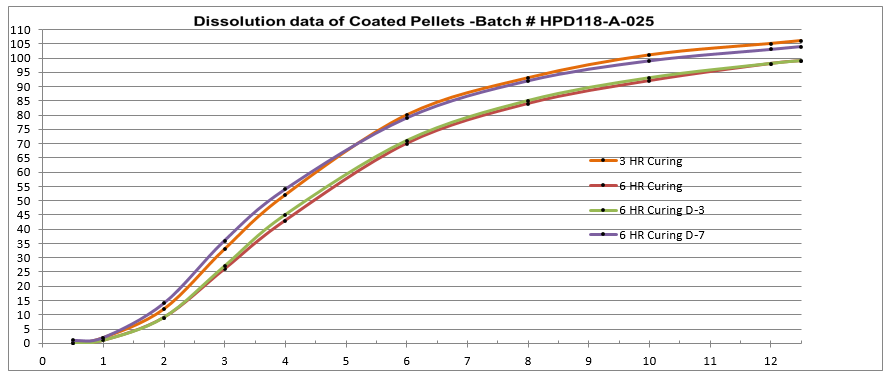 Figure 4: Process SME’s Data Analysis - – Excel Worksheet 3-6 HR
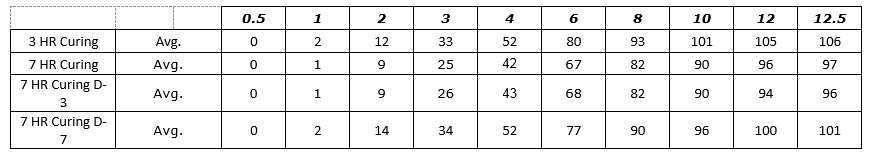
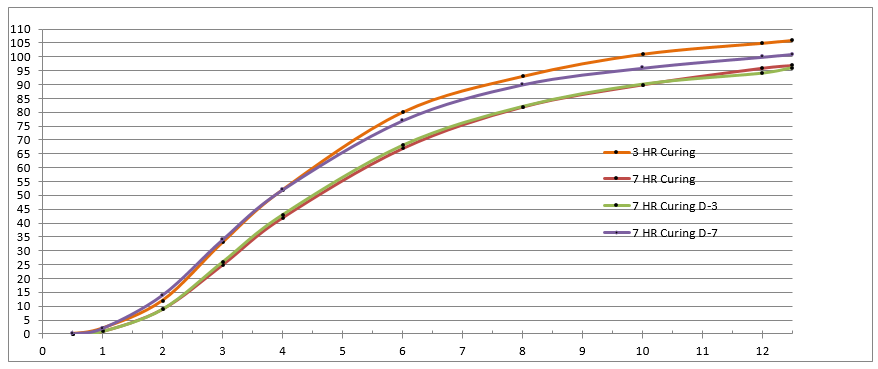 Figure 4: Process SME’s Data Analysis - – Excel Worksheet 3-7 HR
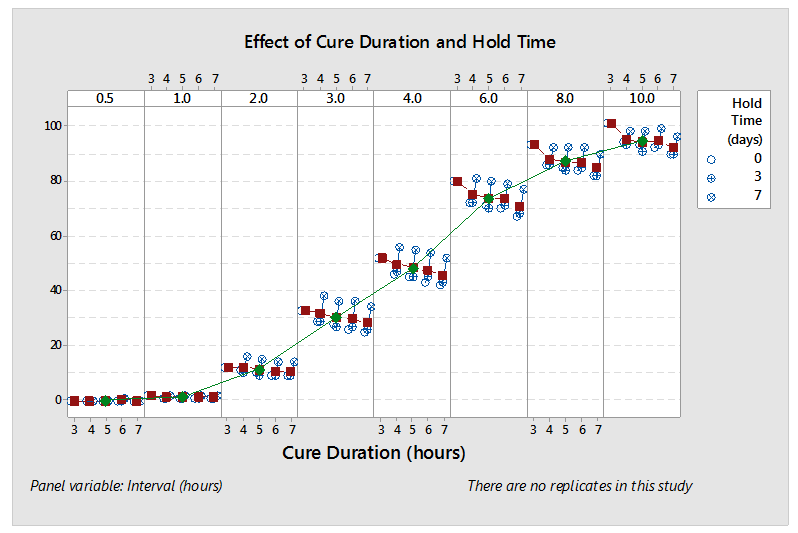 Figure 5: DASME Analysis – One PowerPoint Slide
October 15, 2019
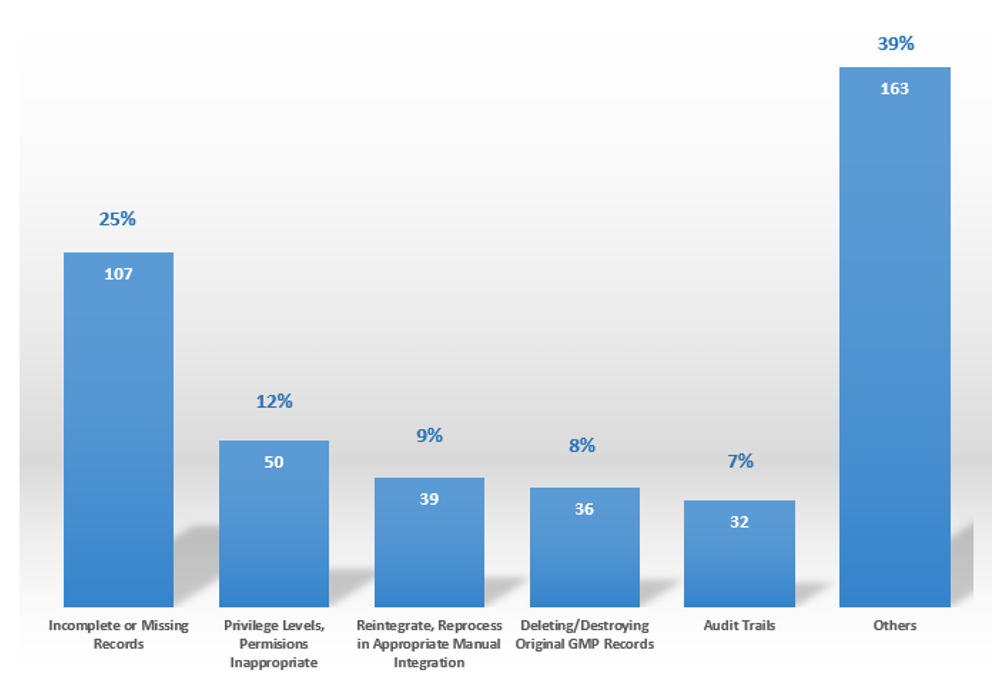
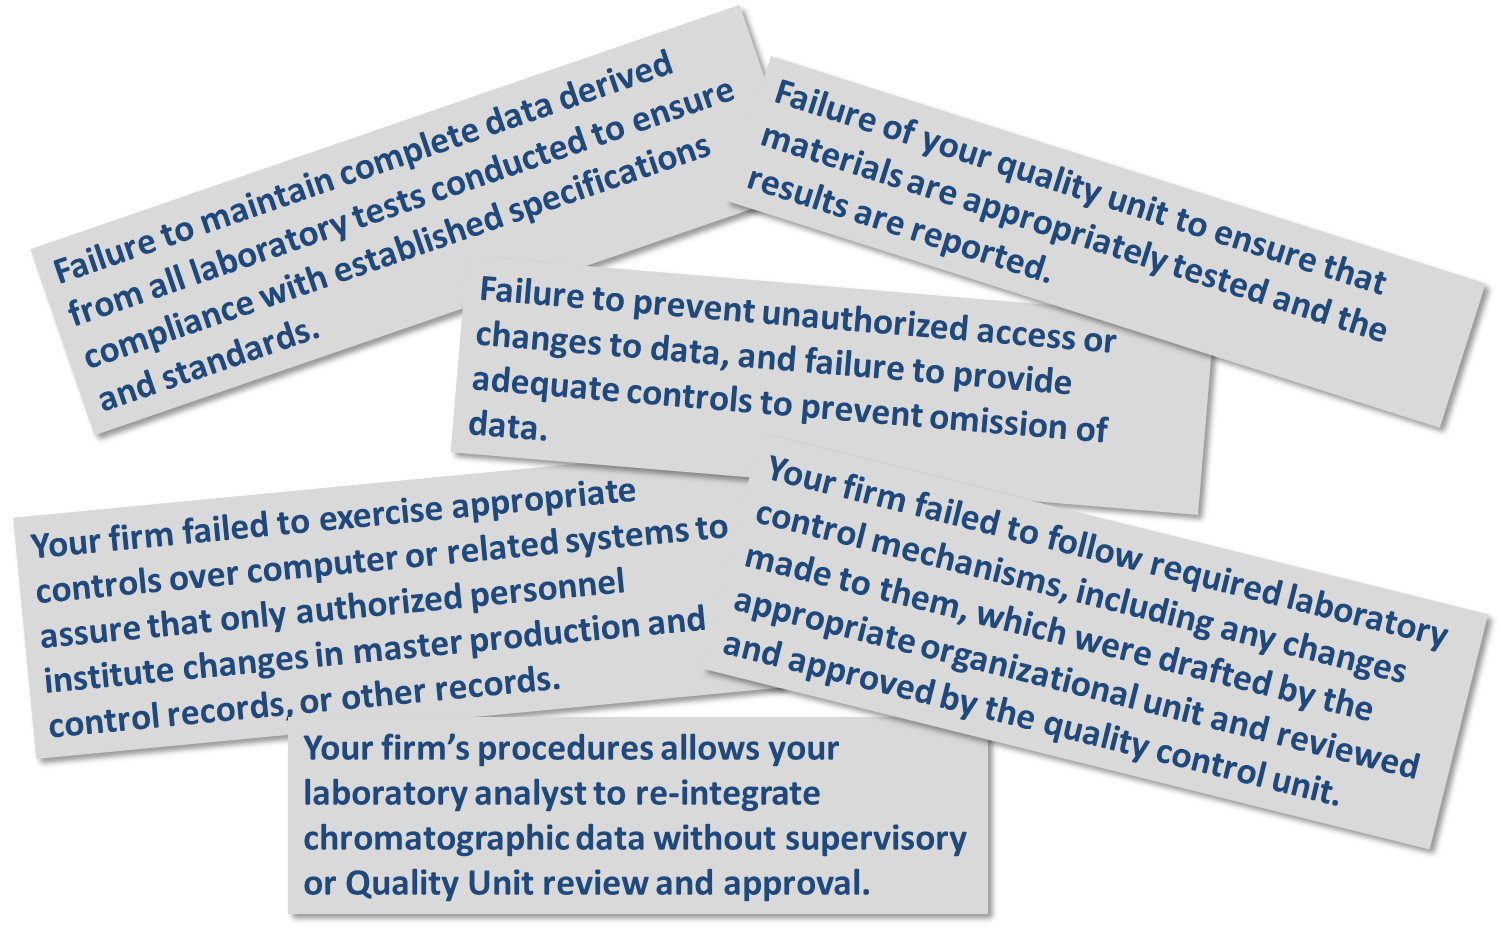
The attention of regulatory agencies continues to focus on data integrity, as observed by the increase of FDA observations over the course of the last few years. Having a proper data lifecycle / data...
September 22, 2021
The corporate and quality culture has a significant effect on the maturity level of Data Integrity within a regulated company and should, therefore, be assessed and understood. To achieve the level...
May 23, 2017
Data integrity has recently been in the agency spotlight. In part because of the draft data integrity guidance issued April 2016, but primarily due to an increased number of inspection findings...